
Bitcoin is a digital currency that has kicked off the blockchain movement and the worldwide notion of cryptocurrency. It operates on a decentralized network, meaning it is not controlled by any central authority. The price of Bitcoin, together with most other coins in the crypto space is volatile, making it a popular asset for traders and investors.
At the same time, Bitcoin has created jobs, became the perfect payment solution for a wide range of use cases, and brought transparency to a wide range of industries. In this article, we will explore the tools used to analyze the historical and current price of Bitcoin and how they can be used to make good trading decisions.
Price Analysis
Price analysis is the process of evaluating the current and historical price trends of Bitcoin, to identify patterns and make predictions about future movements of its valuation. There are several tools that traders and investors use to analyze the price of Bitcoin, and we will explore some of them in the following sections.
Technical Analysis
Technical analysis is the most common approach used to analyze the price of Bitcoin. It involves studying historical price charts and using various indicators to identify trends and predict future price movements. Some of the most commonly used indicators include moving averages, relative strength index (RSI), and Bollinger Bands.
Moving averages are used to identify trends in the price of Bitcoin over a specific time period. They are calculated by averaging the price of Bitcoin over a specific period, such as the last 50 days. The crypto community uses moving averages to identify potential buy and sell signals, or in other words, the best time to enter and exit the market.
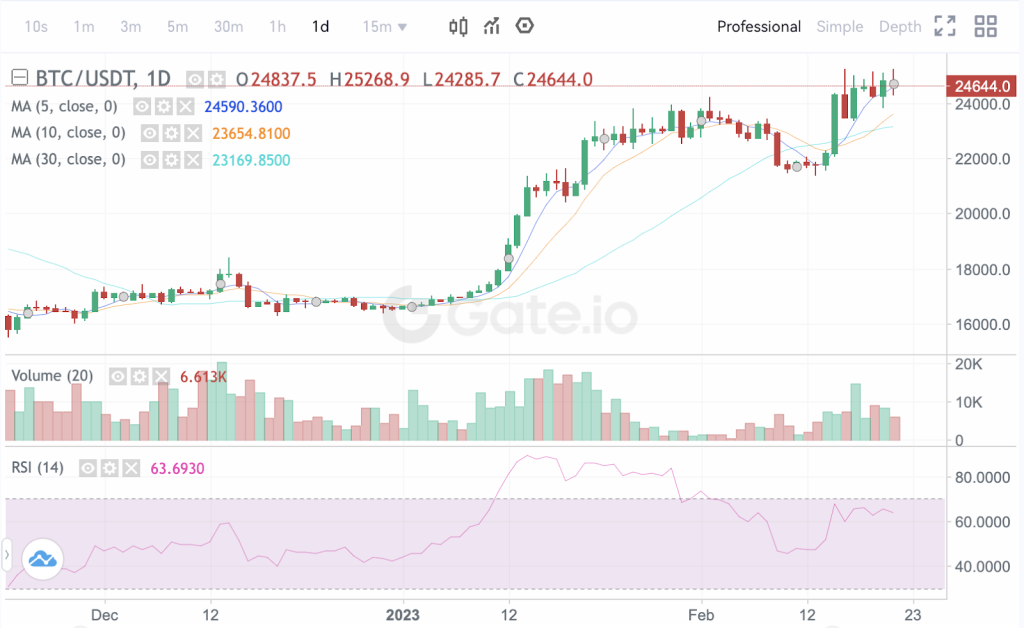
The relative strength index (RSI) is a momentum indicator that measures the strength of the price of Bitcoin over a given time period. It is calculated by comparing the average gain and average loss of Bitcoin over a specific period, usually 14 days. An RSI value of above 70 is considered overbought, while a value below 30 is considered oversold.
As an example, the current RSI level showcased by Gate.io crypto exchange shows that BTC is at its natural market level. It is neither oversold nor overbought, which would have been the result of drastic market movements.
Bollinger Bands are used to measure the volatility of the price of Bitcoin. They consist of an upper and lower band that is placed two standard deviations away from a moving average. Crypto traders use Bollinger Bands to identify potential buy and sell signals when the price of Bitcoin reaches the upper or lower band.
Fundamental Analysis
Fundamental analysis is another approach that is widely used in Bitcoin trading. It involves evaluating the underlying factors that affect the value of Bitcoin, such as the supply and demand for the currency, adoption rates, and regulatory changes. Fundamental analysis is used to make long-term investment decisions, rather than short-term trading decisions.
Tools for Bitcoin Price Analysis
There are several tools available for traders and investors to analyze the price of Bitcoin. Some of the most commonly used tools include:
- Gate.io: As one of the most well-established crypto exchange platforms, it provides one of the widest ranges of price analysis tools. Investors love the fact that indicators on it can be applied to the current and historical price charts without having to make any preliminary setups. You just click and see exactly what you are looking for. Start trading BTC with Gate.io now.
- TradingView: TradingView is a popular charting platform that provides real-time data for Bitcoin. It allows traders to create custom charts.
- CoinMarketCap: Just like all of the above, CoinMarketCap provides real-time data for the price, market capitalization, and trading volume of Bitcoin and other cryptocurrencies.
The right time to buy BTC
Analyzing the price of Bitcoin is an essential part of trading for crypto investors who want to win the market. Technical analysis and fundamental analysis are the two most common approaches used to analyze the price of Bitcoin and since so many people use them, some say that it makes the market extremely predictable. It’s something you should always keep in mind as it may give you an extra angle when trading Bitcoin. Apart from the above, do read the news, stay informed, and always research before you buy or sell crypto.